A look at the screens
What Tilth actually does.
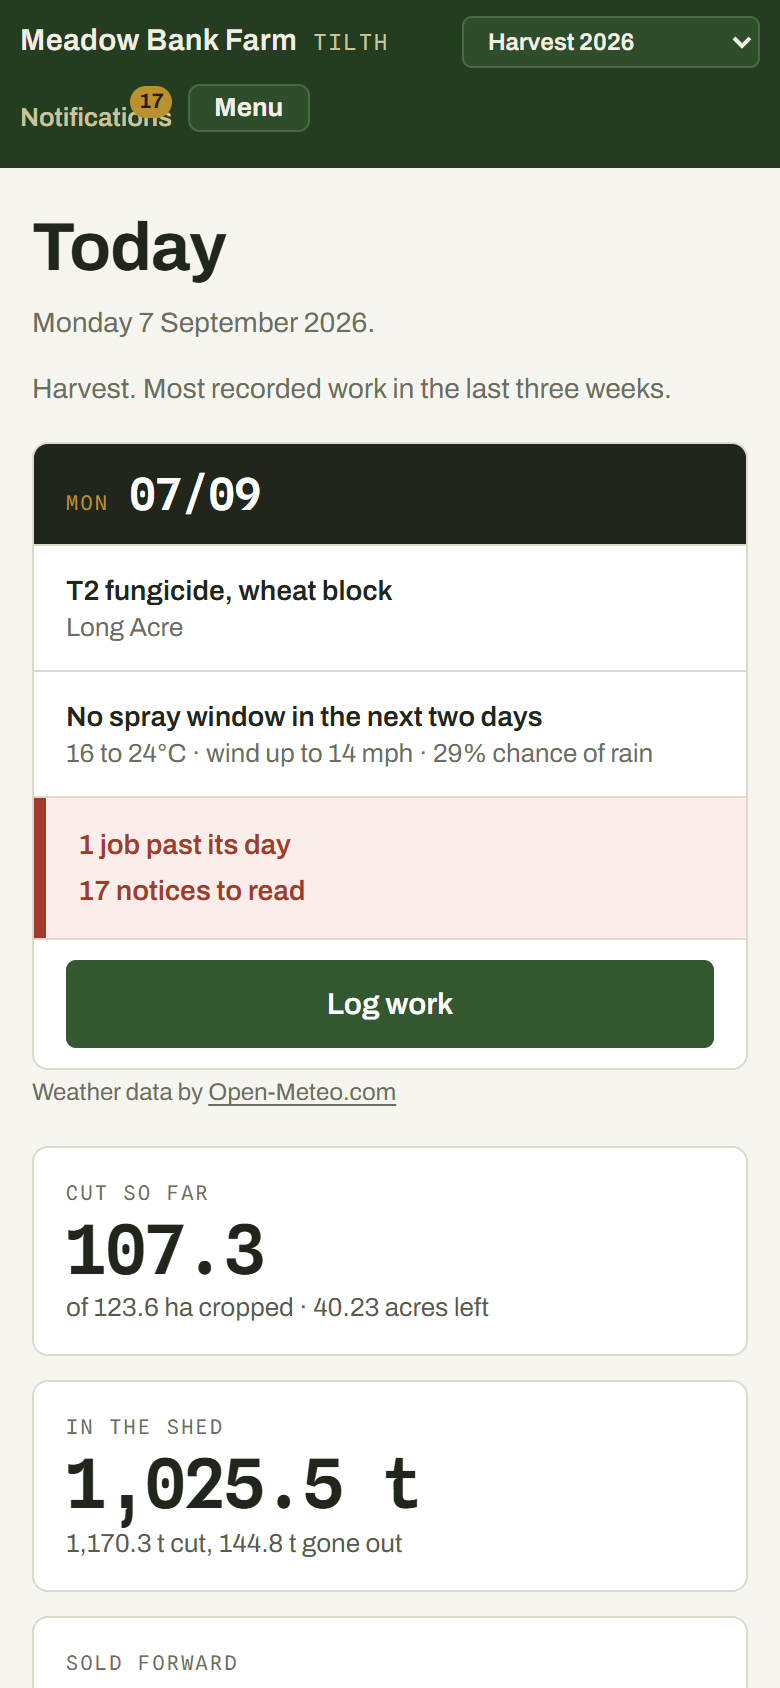
Every picture below is the app itself, on a demo farm. The fields are real registered parcels, so the map is a real map. The cropping, the records and the people on them are made up, because no farmer's own records belong on a page like this.
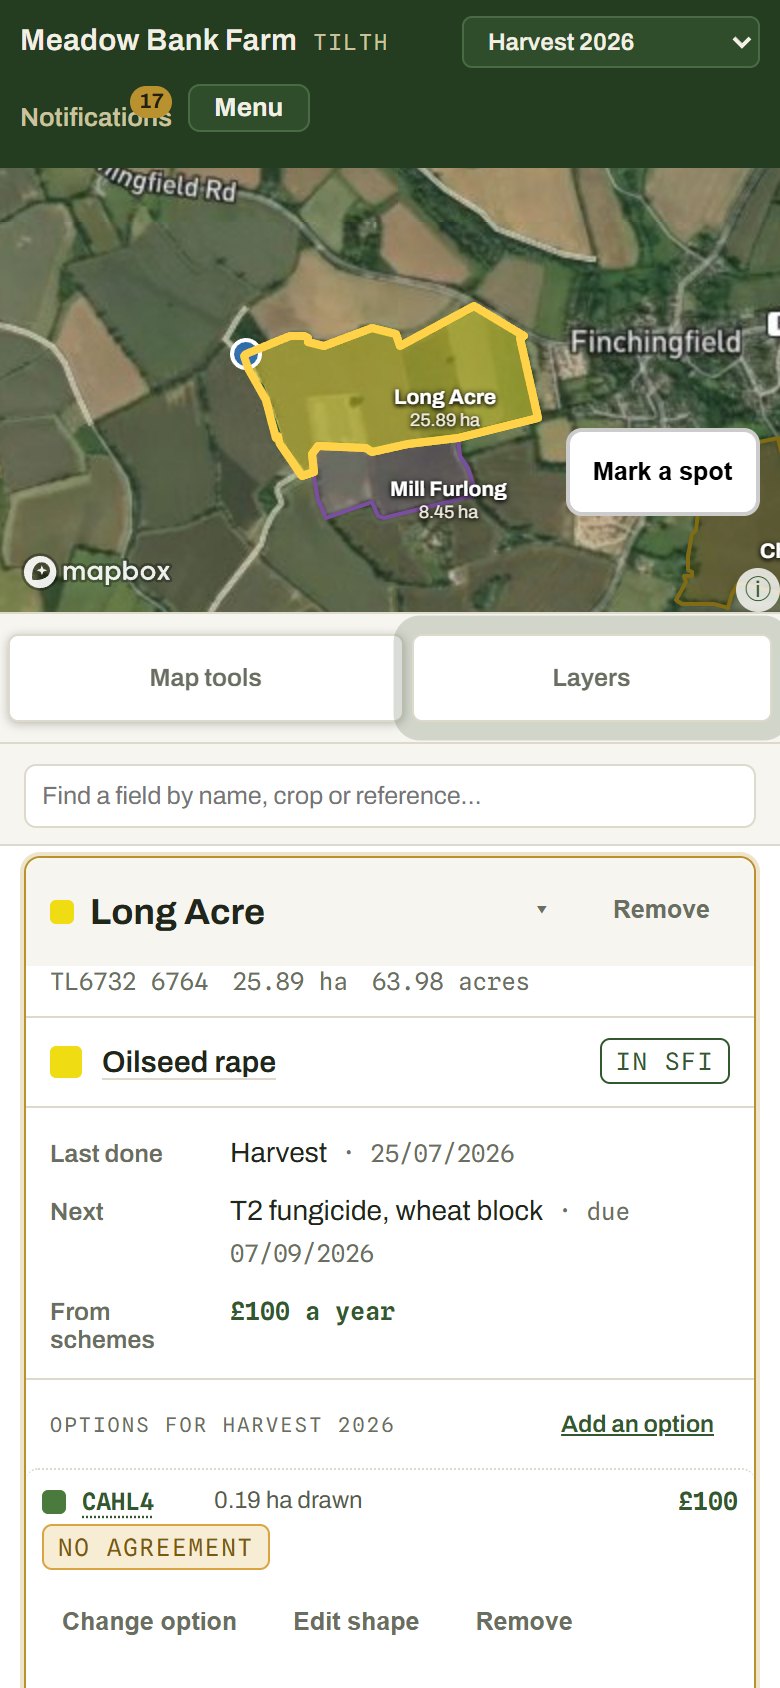
Your fields, on satellite
Draw your boundaries, or import them by SBI and correct what the RPA holds. Shapefiles and GeoJSON come in too.
Each field keeps its area in hectares and acres, its soil, whether it sits in an NVZ, and its parcel reference. Crops colour the map, so the rotation reads at a glance.
Open a field and it says what is in it, what was last done, what is next, and what it earns from schemes.
How the crop is doing, from space
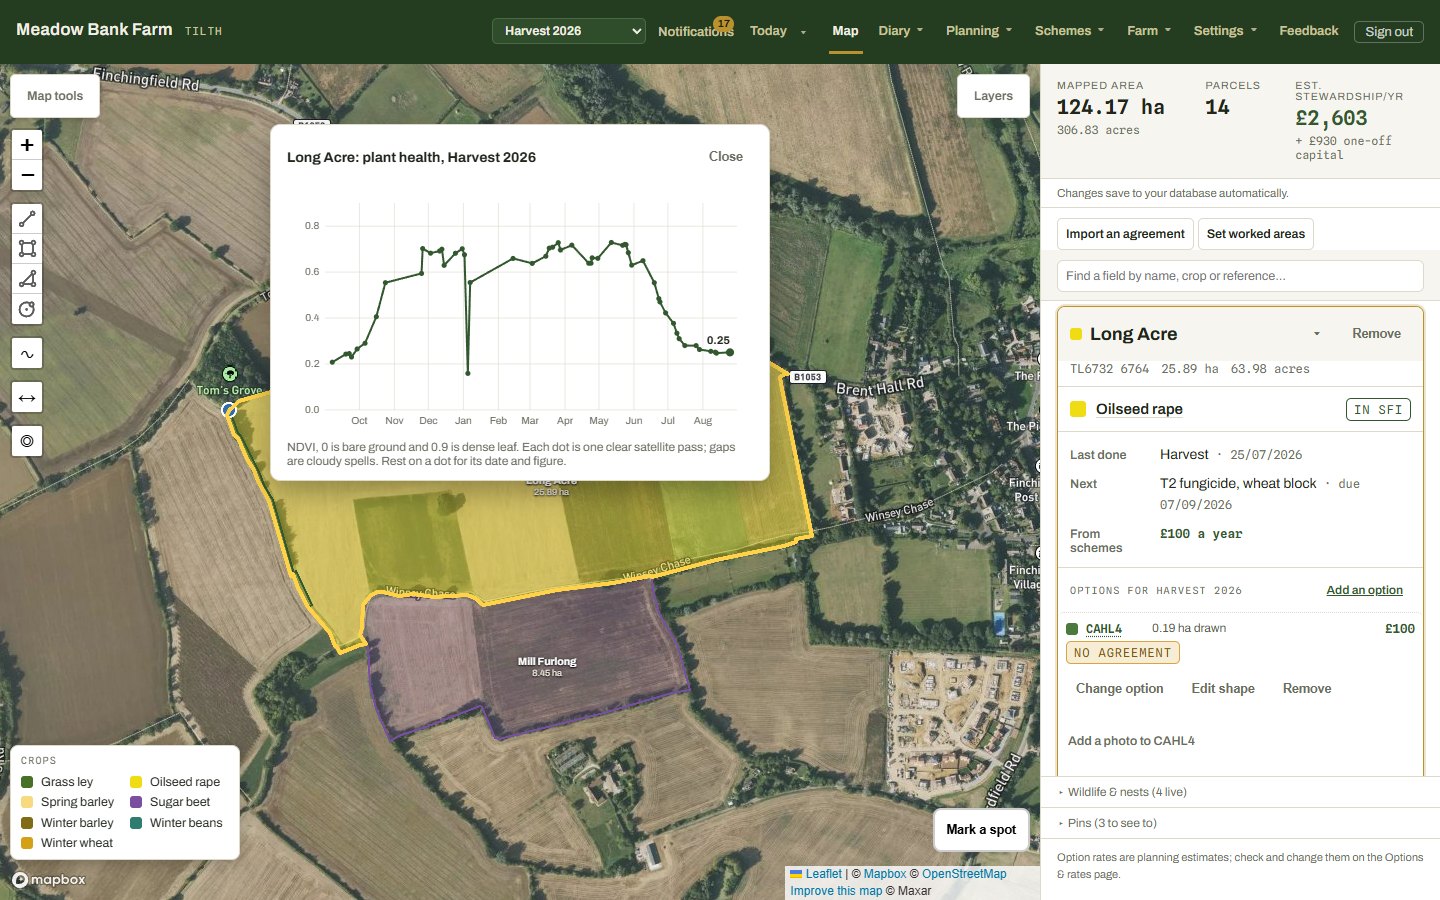
Every clear satellite pass over your ground, read field by field and drawn as a season. Nought is bare earth and nine tenths is dense leaf, so you watch the crop come through the winter, build in the spring and ripen off.
It is included, it needs no kit on the farm, and it is the cheapest way there is to find the part of a field that is not paying. The readings are Copernicus Sentinel's, over real ground: that graph is not a drawing.
Variable rate, straight to the spreader
Turn that reading into a rate map. Pick the fields, choose what drives it (the satellite, a yield file off the combine, or a soil service's results), set a rate against each zone, and it works out the product you need.
Several fields go into one file, so whoever is spreading loads the terminal once and drives. It comes out as a zipped shapefile, and as ISOXML for newer ISOBUS terminals.
It works the same for solid fertiliser and for liquid through the sprayer. Every figure in it is yours: nothing here decides your rates for you.

One diary for everything done
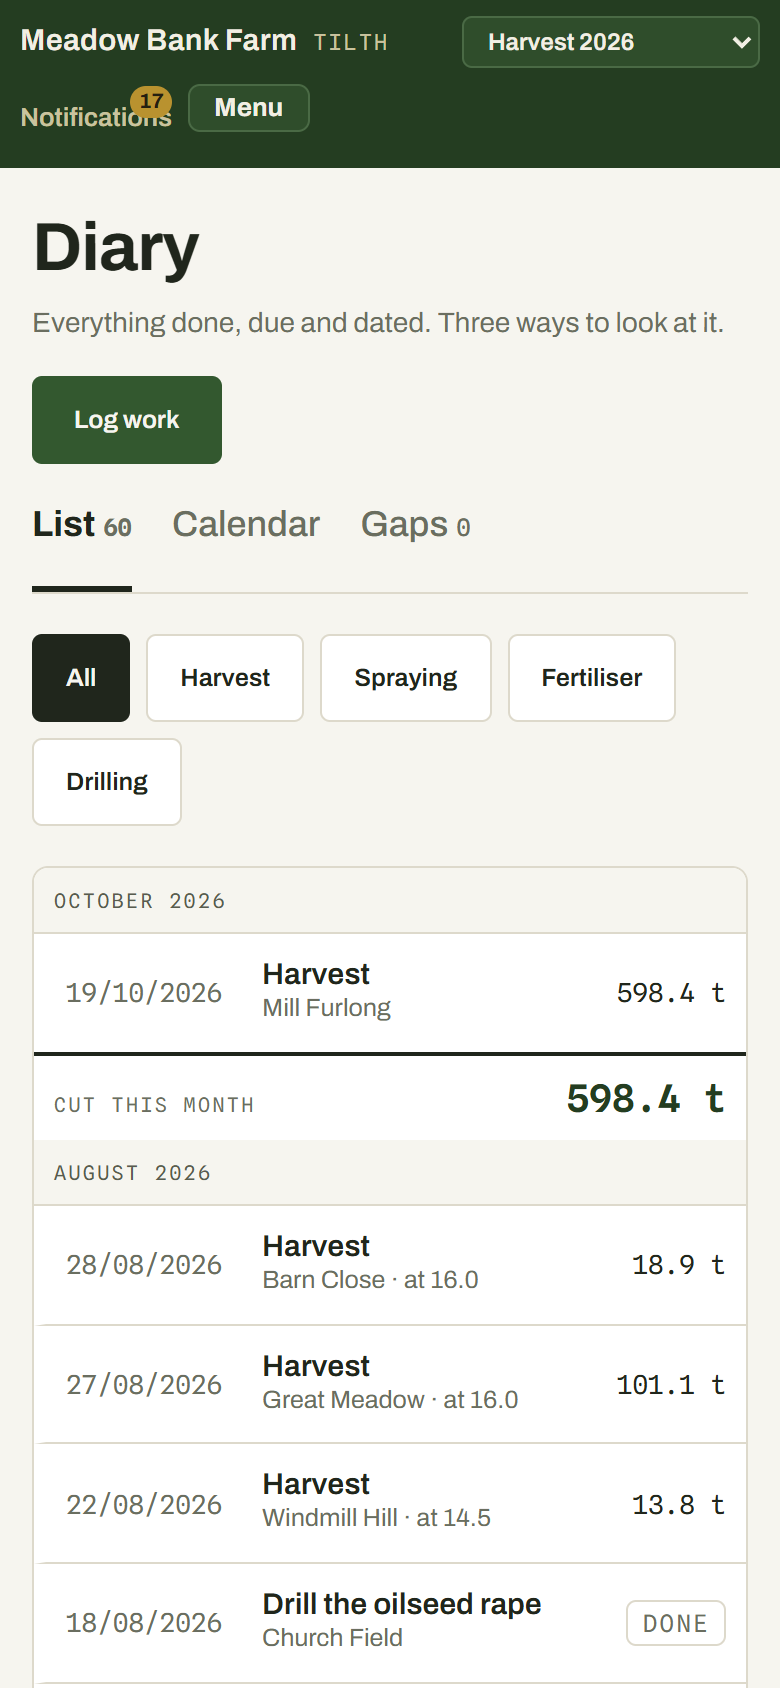
Spraying, fertiliser, drilling, harvest and every other job land in one dated list you can filter, with what is still due sitting beside what is finished.
Tonnes total as you go. There is a calendar view and a gaps view, which is the one that finds the job somebody did and never wrote up.
Records an assessment will accept
A spray record carries the boxes Red Tractor asks for: the tank mix with MAPP numbers and rates, who sprayed, start and finish times, wind, temperature, water volume, growth stage, the reason, the LERAP decision and the harvest interval.
Tick the fields the job covered and it writes one record for each. What you used comes off the chemical store as you save it.

Stewardship, and what it pays per field
Import an SFI or Countryside Stewardship agreement and its options land on the fields they belong to. Draw an option on the map and see what that piece of ground earns.
Rates come from the published GOV.UK figures and stay editable, because they change and no app should hard-code them.

Nutrients and NVZ
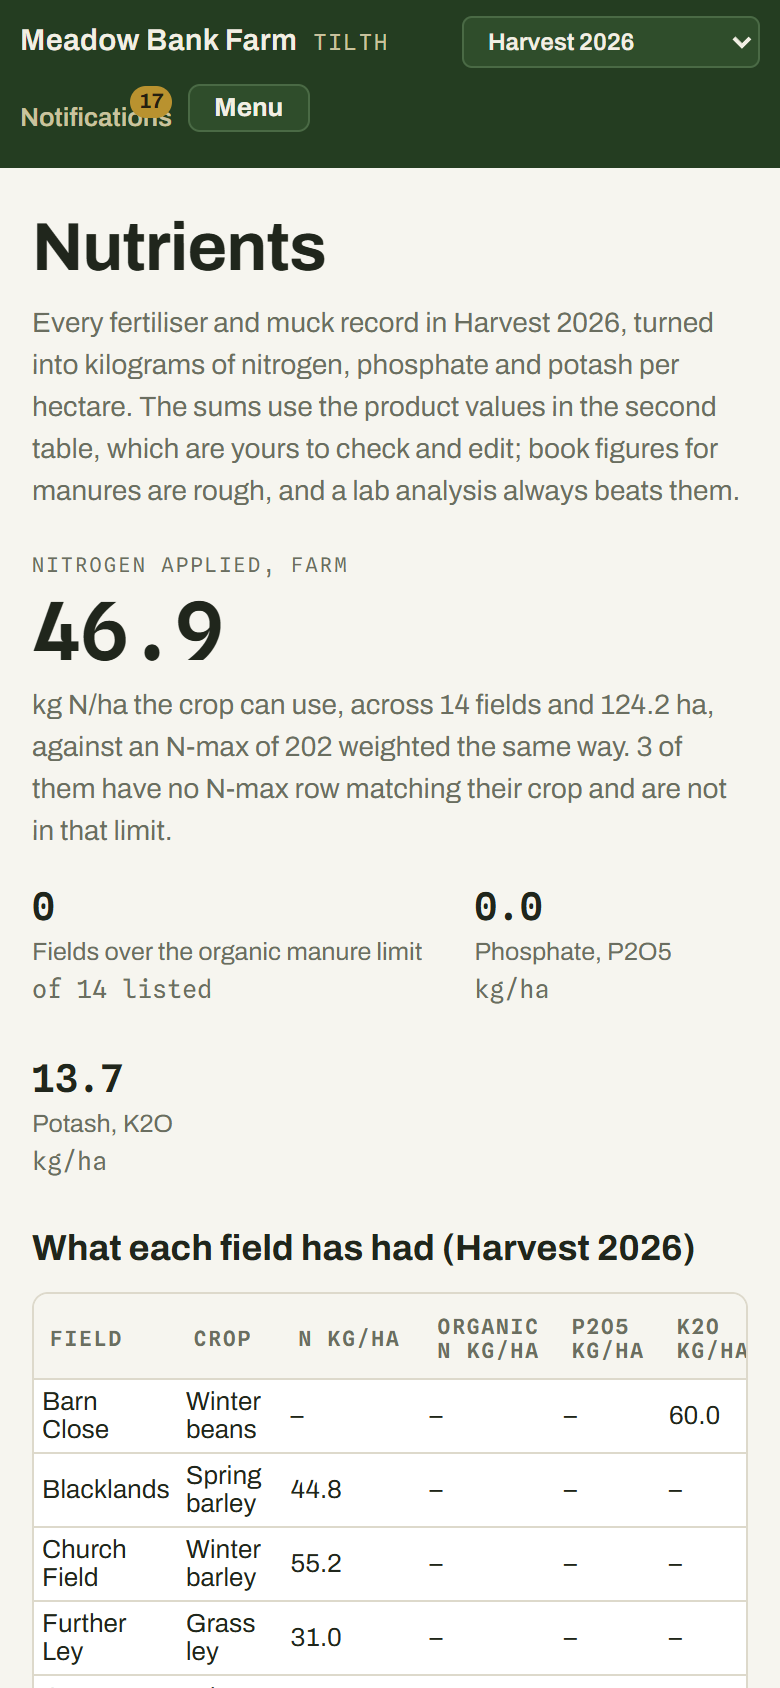
Nitrogen in and nitrogen allowed, per field and per farm, with the closed period and the N max limits worked out from what you have actually recorded.
The figures come from your own fertiliser records rather than a separate spreadsheet nobody updates, so the nitrogen you are judged on is the nitrogen you actually put on.
Your data is yours, and it leaves in one press
Everything comes out: every record, every boundary, every file, in ordinary formats you can open elsewhere. Not a report, the actual data.
It is never rate limited, never held back, and never used as a reason to stay. If a subscription ever lapses the farm goes read only and the export still works, for good.

And out on the ground
It installs to a phone home screen like an app, and it keeps working when the signal does not: record it in the field and it goes up when you come back into signal.
And the rest of it
Livestock with moves, medicines and withdrawal periods. Machinery with faults, services and certificates. Soil results and what they recommend. Yield import and gross margins. A chemical store that goes in and out as you record. Grain contracts and the loads against them. Field sheets and evidence packs for an inspection. More than one farm on one account, with roles, so everybody sees only what they should.
All of it is in the one price, and nothing is priced by the hectare.
Have a look at it on your own farm
Free up to 50 hectares and two people, for good. A whole farm is £200 a year or £25 a month. The price is on the front page in plain figures, which is more than the big systems will tell you.